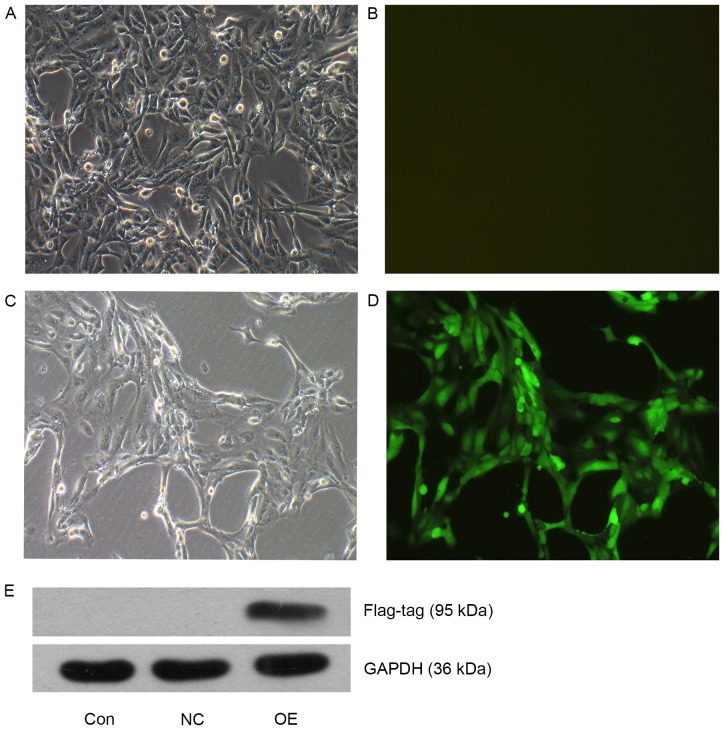
Figure 1.
TFE3 overexpression in ACHN cells. Visualization of ACHN cells in the OE group (A and B) prior to puromycin selection, and (C and D) following 48 h of puromycin selection. Magnification, ×100. (E) Western blot analysis of TFE3 expression in the three experimental groups. FLAG-tagged TFE3 was detected at 95 kDa. TFE3, transcription factor E3; OE, overexpression; NC, negative control; Con, control.

