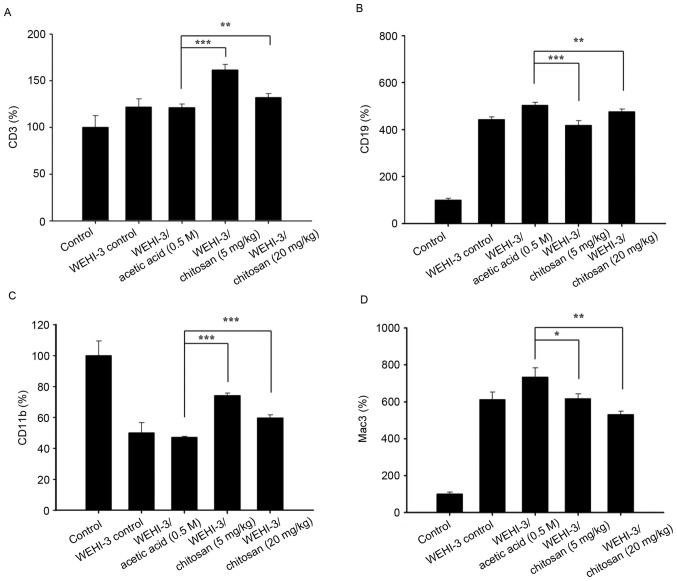
Figure 2.
Effects of chitosan on levels of cell markers in white blood cells from leukemia BALB/c mice. Blood was collected from all mice and was analyzed for (A) CD3, (B) CD19, (C) CD11b and (D) Mac3 levels by flow cytometry. Data are expressed as the mean ± standard deviation of three independent experiments (n=10/group). *P<0.05, **P<0.01, ***P<0.001. CD, cluster of differentiation.

