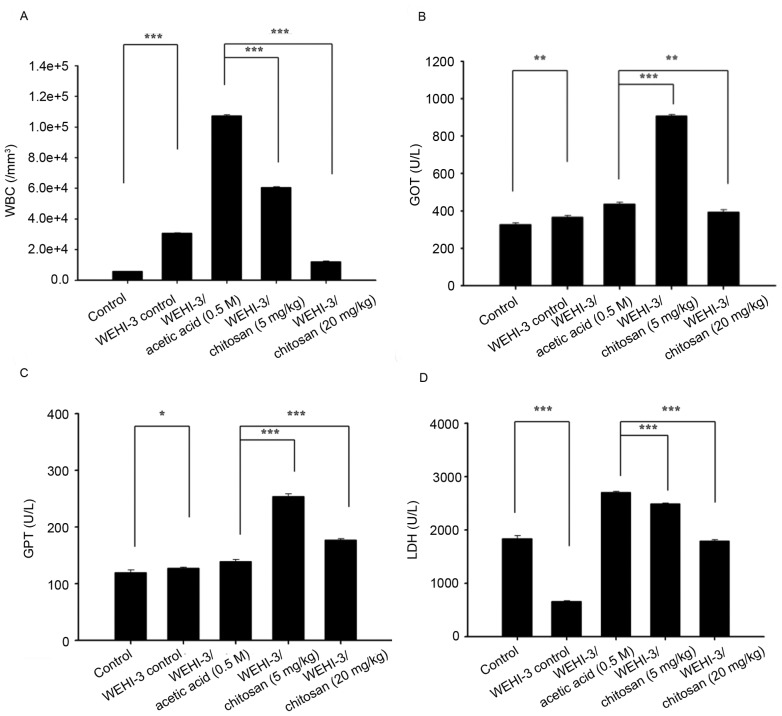
Figure 6.
Measurement of total WBCs, GOT, GPT and LDH activity of leukemia BALB/c mice after exposure to chitosan. (A) WBC numbers, and (B) GOT, (C) GPT and (D) LDH levels. Data are expressed as the mean ± standard deviation of three independent experiments (n=10/group). *P<0.05, **P<0.01, ***P<0.001. GOT, glutamic oxaloacetic transaminase; LDH, lactate dehydrogenase; GPT, glutamic pyruvic transaminase; WBC, white blood cell.

