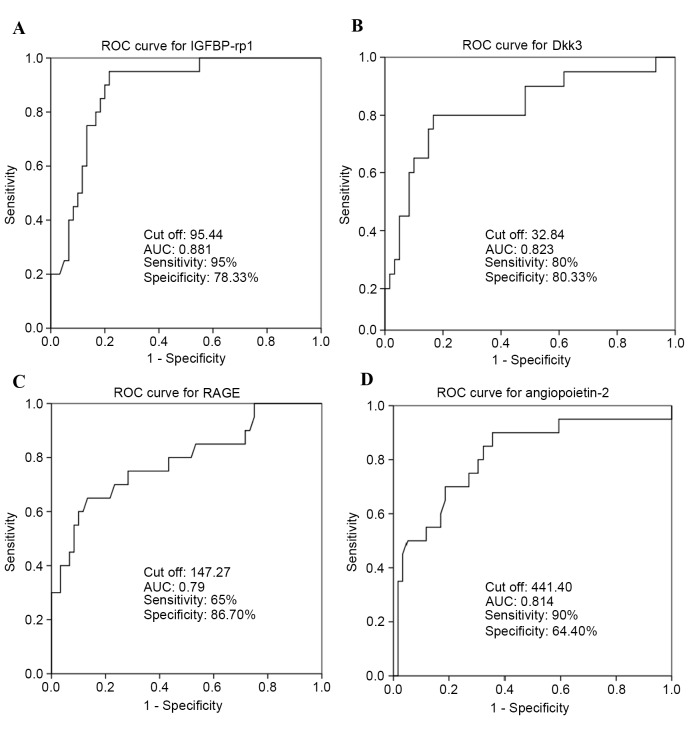
Figure 5.
ROC curve analysis for the four upregulated serum cytokines as validated by ELISA. The area under the ROC curve (AUC) indicates the mean sensitivity of the biomarkers (A) IGFBP-rp1, (B) Dkk3, (C) RAGE and (D) angiopoietin-2 (Fig. 5D). 0.5≤AUC≤1, the biomarker is strongly differential between patients and controls; AUC≤0.5, no predictive value. ROC, receiver operating characteristics curve; IGFBP-rp1/IGFBP-7, insulin-like growth factor-binding protein-related protein 1/insulin-like growth factor-binding protein 7; Dkk3, Dickkopf-related protein 3; RAGE, receptor for advanced glycation end products; RSA, recurrent spontaneous abortion.

