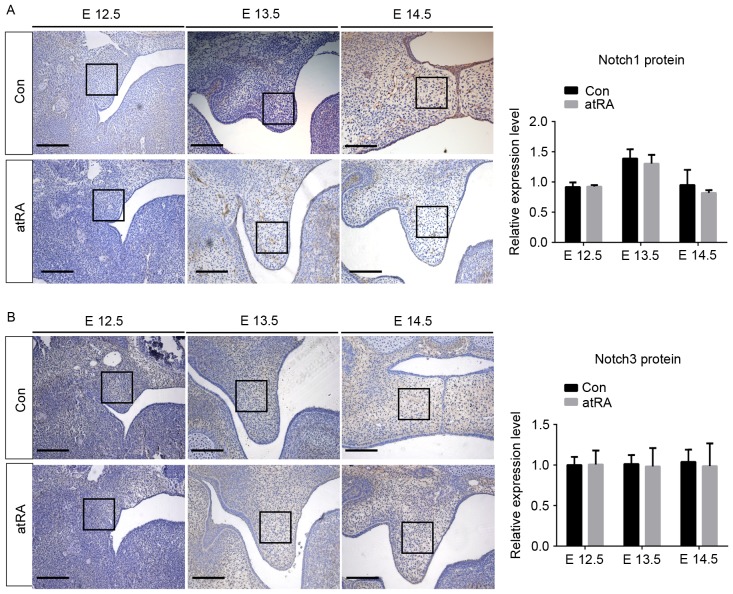
Figure 2.
Immunohistochemistry revealed the expression of Notch1 and Notch3 in palatal tissue isolated from control and atRA-treated embryos between E12.5 and E14.5. (A) Notch1 expression in palatal shelves isolated from atRA-exposed and control E12.5–14.5 embryos. (B) Notch3 expression in palatal shelves isolated from atRA-exposed and control E12.5–14.5 embryos. Scale bars, 20 µm. atRA, all-trans retinoic acid; E, embryonic day; Con, control.

