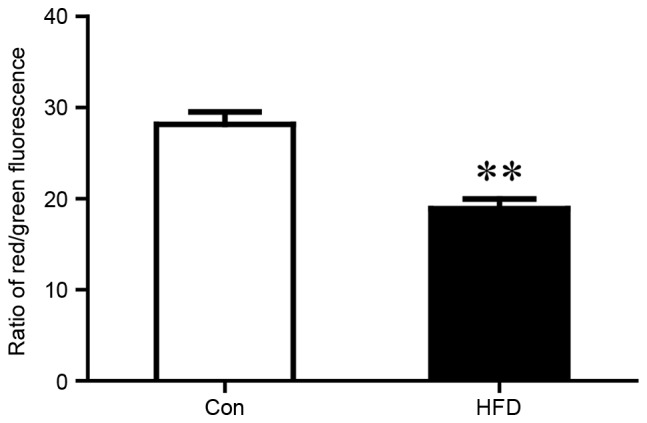
Figure 4.

MMP was reflected by the ratio of red and green fluorescence. Liver mitochondria from the Con and HFD groups were isolated for MMP analysis. The values are presented as the mean ± standard deviation. **P<0.01 vs. Con group. MMP, mitochondrial membrane potential; HFD, high fat and high cholesterol diet; Con, control.
