Fig. 5.
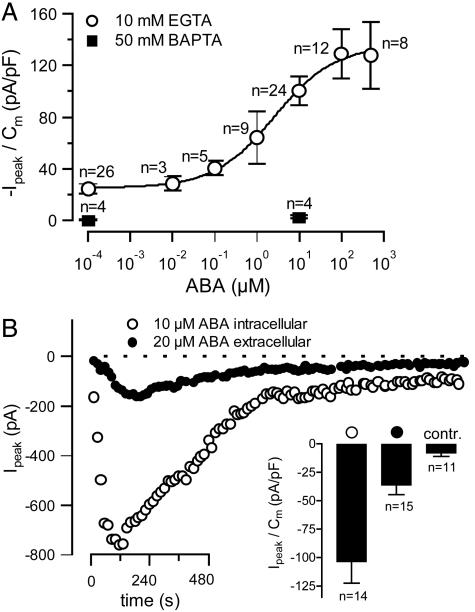
Activation of anion currents in guard cell protoplasts by extracellular and intracellular ABA. (A) Voltage ramps in the presence of different ABA concentrations in the pipette solution were applied and peak currents were determined, as in Fig. 4. The maximum currents during the ABA responses were normalized to the cell capacitance and plotted as a function of the ABA concentration (error bars represent SE, n indicates number of cells). Two cells with unusually high ABA responses were not included in the analysis. Filled symbols represent data obtained with a pipette solution containing 50 mM BAPTA instead of 10 mM EGTA. (B) Time courses of peak currents from voltage ramps as shown in Fig. 4A Upper, recorded after whole-cell access. Time courses are shown for representative experiments in which 20 μM ABA was given at the extracellular face (filled symbols) or 10 μM ABA was applied by means of the pipette solution (open symbols). (Inset) Average peak currents after intracellular (open symbols), or extracellular (filled symbols) ABA application, or without ABA (contr.). Error bars represent SE, n indicates number of cells.

