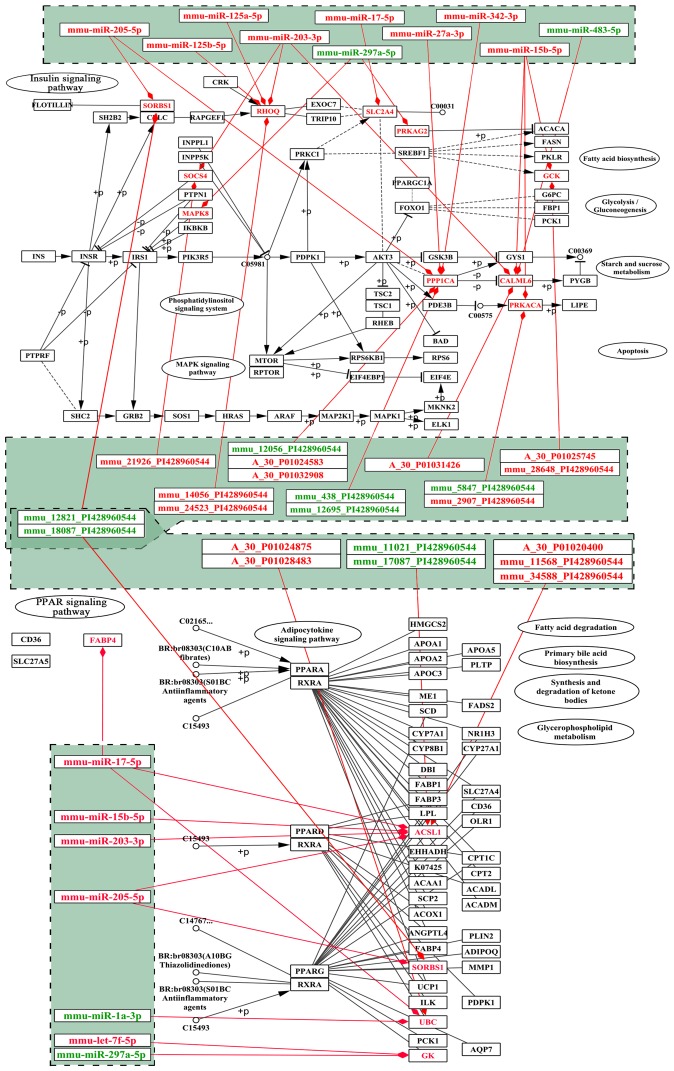
Figure 10.
Risk genes mapping into PPAR and insulin signaling pathways. The upper layer represents differentially expressed lncRNAs that may regulate risk genes; the middle layer represents differentially expressed miRNAs that target risk genes; the bottom layer represents signaling pathways. Upregulation is indicated in red, downregulation in green. lncRNA, long non-coding RNA; miRNA, microRNA.

