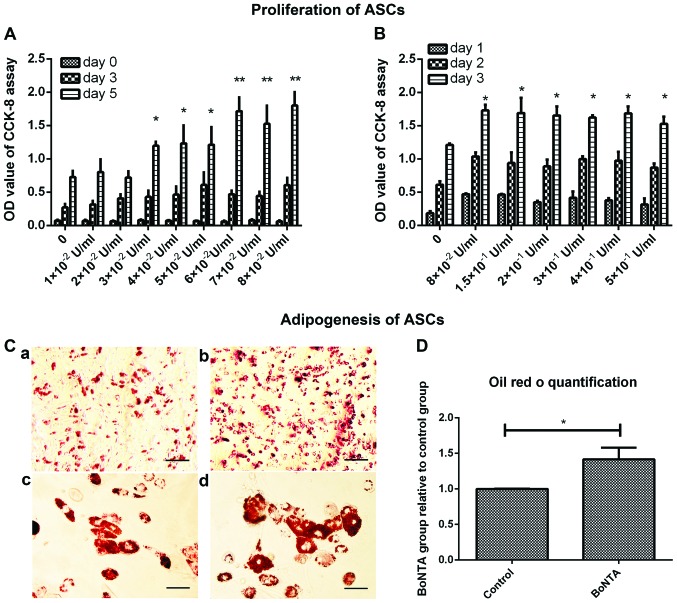
Figure 4.
Proliferation and adipogenesis of ASCs was examined. CCK-8 assay was conducted after the cells were incubated with 1×10⁻², 2×10⁻², 3×10⁻², 4×10⁻², 5×10⁻², 6×10⁻², 7×10⁻², 8×10⁻² U/ml BoNTA for 5 days (A); the cells were treated with 8×10⁻², 1.5×10⁻¹, 2×10⁻¹, 3×10⁻¹, 4×10⁻¹, 5×10⁻¹ U/ml BoNTA for 3 days (B). The control group (C-a and C-c) and BoNTA group (C-b and C-d) were stained with Oil Red O after being induced to differentiate into adipocytes on day 8 (C-a and C-b; scale bar, 2 µm; C c and C d; scale bar, 2 µm). Quantification of Oil Red O staining was assessed by isopropanol leaching and absorbance at 51 nm (D). Data are the means ± standard deviation of 3 separate experiments. *P<0.05, **P<0.01, t-test vs. control (no treatment). ASCs, adipose-derived stem cells; BoNTA, botulinum toxin A.

