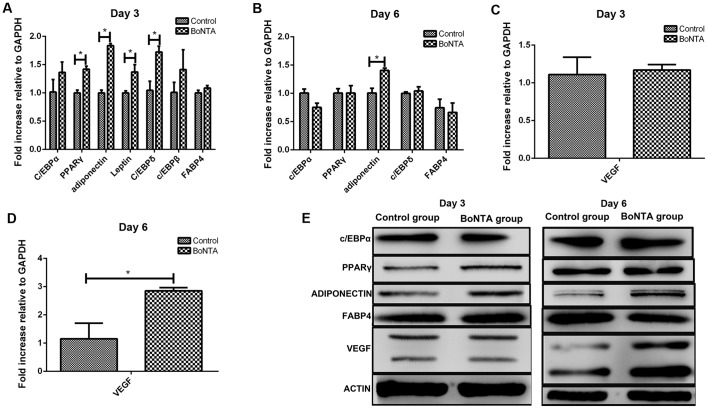
Figure 5.
Results of RT qPCR and western blot analysis are displayed on days 3 and 6. RT qPCR indicated that the BoNTA group exhibited a significant increase in the expression levels of PPARγ, leptin and C/EBPδ on day 3 (A) and a significant increase in the expression of adiponectin on day 3 and 6 (A and B). A significant increase in the expression of VEGF was displayed on day 6 (D) with any distinct difference on day 3 (C). Western blot analysis displayed that the BoNTA group exhibited a significant increase in the expression levels of PPARγ and adiponectin on day 3, VEGF and adiponectin on day 6 (E). BoNTA, botulinum toxin A; PPARγ, peroxisome proliferator-activated receptor; VEGF, vascular endothelial growth factor.

