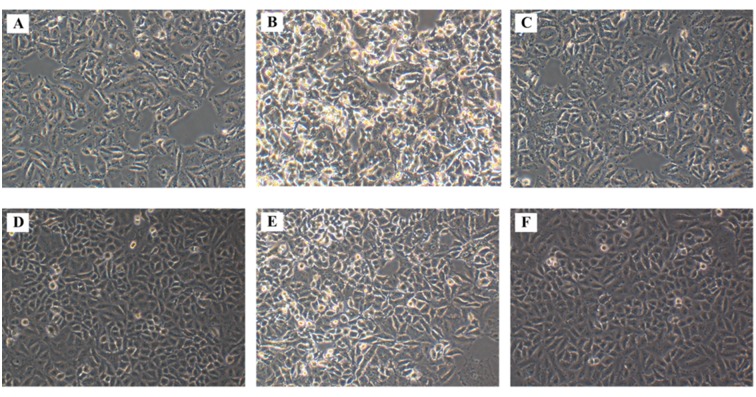
Figure 2.
Morphological alterations of human A549 pulmonary epithelial cells following HG exposure. Representative photomicrographs of cells cultured in (A) normal glucose conditions, (B) HG conditions, (C) hyperosmotic conditions, (D) HG conditions + tyrphostin AG490, (E) HG conditions + empty vector and (F) HG conditions + pcDNA3.1-SOCS3 expression vector. Photomicrographs were captured using an inverted microscope. Magnification, ×200. HG, high glucose; SOCS3, suppressor of cytokine signaling.

