
Figure 5.
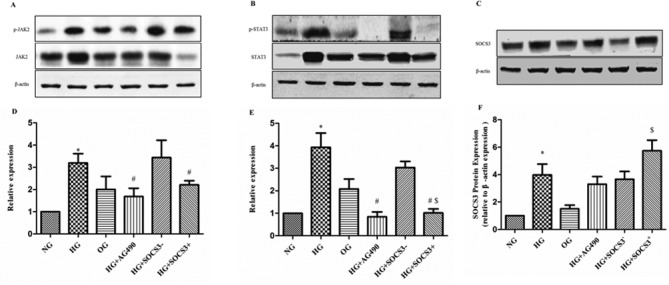
Protein expression levels of p-JAK2, p-STAT3 and SOCS3 in human A549 pulmonary epithelial following various treatments. Protein expression levels of (A) p-JAK2 and total JAK2, (B) p-STAT3 and total STAT3 and (C) SOCS3, were detected using western blot analysis. β-actin was used as the loading control. Blots were semi-quantified using densitometry. Densitometric analysis of (D) p-JAK2, (E) p-STAT3 and (F) SOCS3. Cells were cultured under NG, HG and OG conditions, with HG + tyrphostin AG490, and with HG + pcDNA3.1-SOCS3 expression vector. Data areexpressed as the mean ± standard error of the mean of 10 independent experiments. *P<0.05 vs. NG group; #P<0.05 vs. HG group; $P<0.05 vs.HG + SOCS3− group. JAK, Janus kinase; NG, normal glucose; HG, high glucose; OG, hyperosmotic group; SOCS3, suppressor of cytokine signaling 3; p-, phosphorylated; STAT, signal transducers and activators of transcription.