Figure 5.

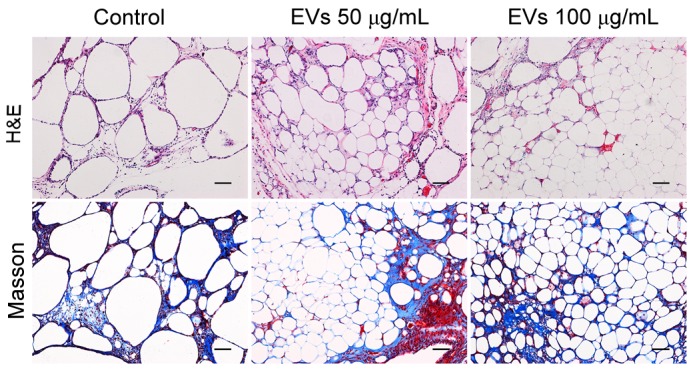
Histological analysis of fat grafts by H&E and Masson trichrome staining. Scale bar, 100 µm. H&E, hematoxylin and eosin.

Histological analysis of fat grafts by H&E and Masson trichrome staining. Scale bar, 100 µm. H&E, hematoxylin and eosin.