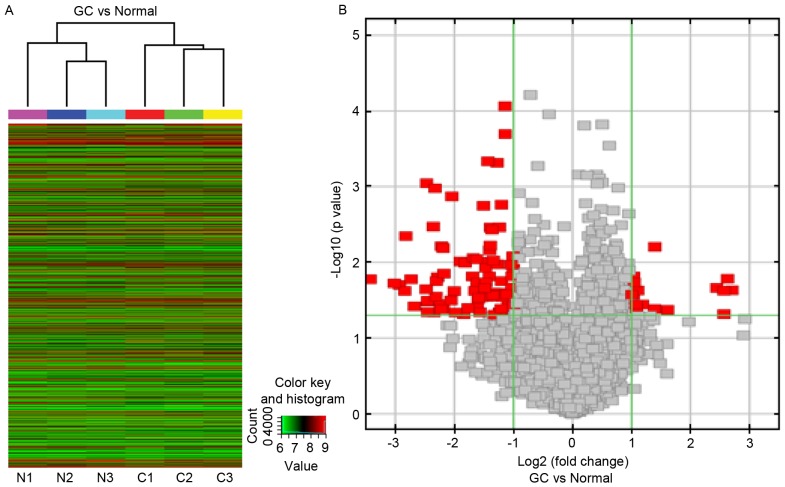
Figure 1.
Expression profile of circRNAs in GC tissue, as determined by microarray analysis. (A) Unsupervised hierarchical cluster analysis, based on the expression levels of circRNAs. CircRNA microarray expression profiles from three sets of matched GC tissue samples (C1-C3) and adjacent normal tissues samples (N1-N3). CircRNAs in red indicate overexpression; those in green indicate reduced expression. (B) Volcano plot analysis based on circRNA expression levels. The vertical green lines correspond to 2.0-fold increased or decreased expression, and the horizontal green line represents P<0.05. Therefore, the red points in the plot represent differentially expressed circRNAs with statistical significance. circRNA, circulating RNA; GC, gastric cancer.

