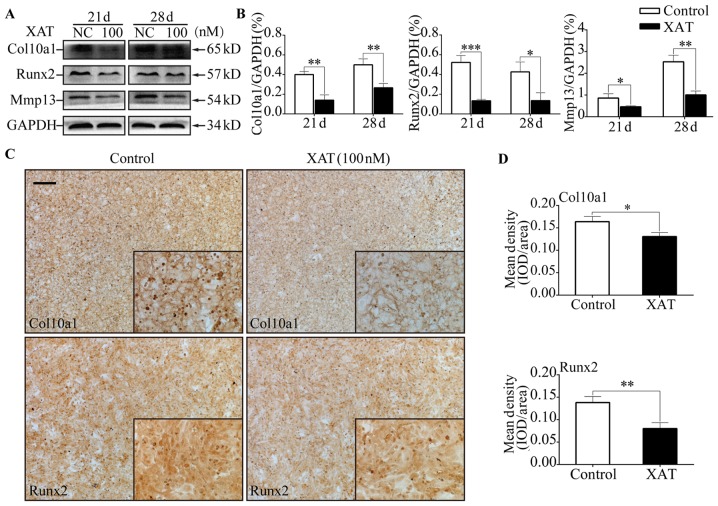
Figure 3.
XAT inhibited expressions of chondrocyte hypertrophic marker genes on protein level. MSCs were induced by chondrogenic medium without XAT for 14 days and then treated with hypertrophic medium together with or without XAT for another 3, 7 and 14 days. (A) Representative western blot images of Col10a1, Runx2, Mmp13 and GAPDH from MSCs in different groups (day 21 and 28). (B) Quantification of normalized expression intensity of Col10a1 and Runx2 against GAPDH. (C) Representative immunohistochemical images of Runx2 and Col10a1 from MSCs in different groups (day 28). Scale bar represents 200 µm. (D) Quantification of mean intensity of Runx2 and Col10a1 in (C). The data in the figures represent the averages ± SD. Significant differences between the treatment and control groups are indicated in the graph with (*P<0.05) or (**P<0.01) or (***P<0.001).

