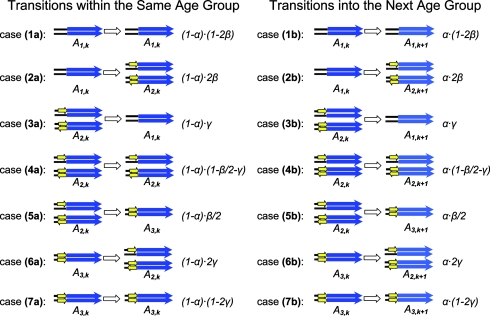
Table 1.
All possible transitions between different states of the duplication flanking regions in a short evolution period Δt
The state of the flanking region pair is defined by the configuration of the repeats (yellow arrows) in the flanking regions and the age group (k) of the duplicated segments (blue arrows) and is schematically displayed. Shown are all the possible transitions within the same age group (k), with the corresponding transition probabilities, and all the possible transitions into the next (older) age group (k to k + 1), with the corresponding transition probabilities. The transition probabilities are expressed by the evolution rates of the repeats and duplicated segments. α, the rate of duplicated segments evolving into an older age group in Δt; β, the insertion rate of the repeat in the flanking regions by mechanisms, such as retrotransposition, in Δt; γ, the decay rate of the repeats in the flanking regions due to mutations in Δt. (See Supporting Appendix for details.)

