Figure 1.

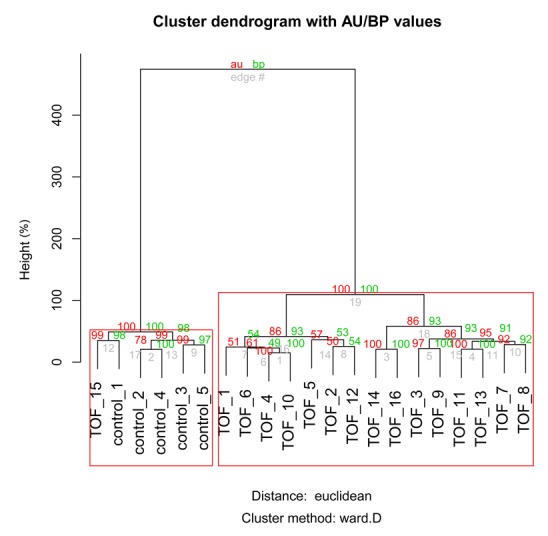
A cluster dendrogram of AU/BP values demonstrating the division of TOF and control samples based on the identified differentially expressed genes. TOF, Tetralogy of Fallot; AU, approximately unbiased value; BP, bootstrap probability value.

A cluster dendrogram of AU/BP values demonstrating the division of TOF and control samples based on the identified differentially expressed genes. TOF, Tetralogy of Fallot; AU, approximately unbiased value; BP, bootstrap probability value.