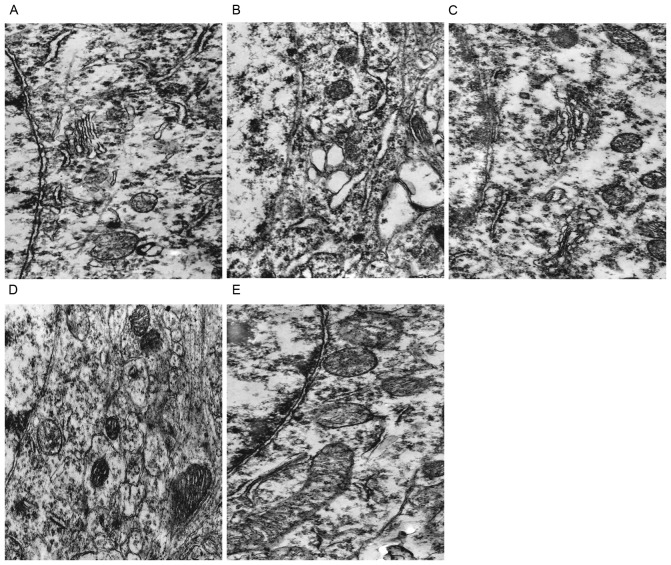
Figure 2.
Representative images of the rat PFC neurons among the groups by TEM (magnification, ×15,000). (A) CON group; (B) Hypo group; (C) DON group; (D) T4 group; (E) T4 + DON group. PFC, prefrontal cortex; TEM, transmission electron microscope; CON, control; Hypo, hypothyroid; DON, donepezil; T4, thyroxine.

