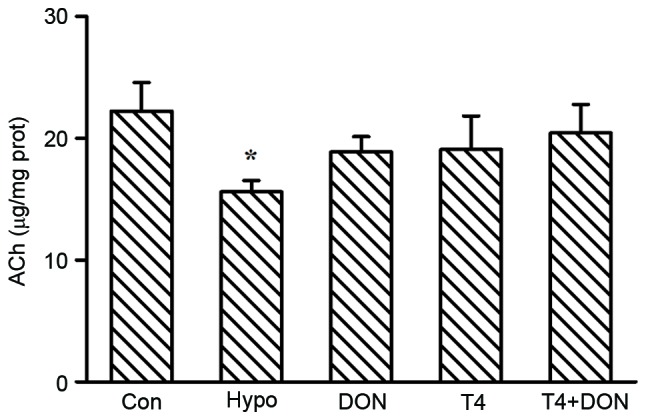
Figure 5.

Concentration of prefrontal ACh from CON, Hypo, DON, T4 and T4 + DON groups (n=10), homogenates were extracted from the PFC of each rat. Data are presented as means ± standard error of the mean of three independent experiments. *P<0.05 vs. CON. ACh, acetylcholine; T4, thyroxine; DON, donepezil; CON, control; Hypo, hypothyroid.
