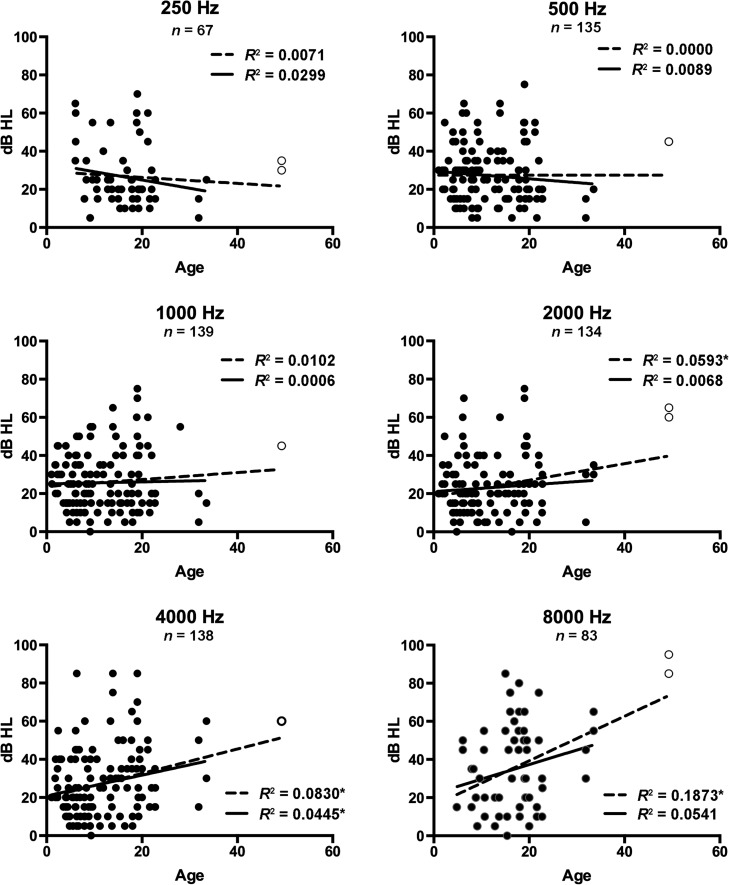
Figure 2.
Bivariate scatterplots and linear regression lines for air conduction pure-tone thresholds for individual ears against age. Linear regressions for all ears are represented by the dotted line, and the subset excluding an outlier by age (open circle) is represented by the solid line. The coefficient of determination (R 2) is shown for each frequency. *Significant at p ≤ .05.

