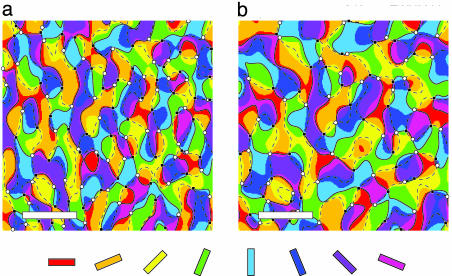
Fig. 2.
Results of blurring orientation data. (a) Synthetic orientation tuning data generated by band-pass filtering random orientation values (30). The original average distance between pinwheel centers is set at 350 × 550 μm, and the number of pinwheels is 124. Positive chirality (i.e., right-handed) pinwheels are indicated by white circles and negative chirality is indicated by black squares. The solid and dashed black lines trace out zero-crossings of the orientation map, whose intersections mark the pinwheel center locations for a continuous orientation map, a result known as the sign theorem (36). (b) Blurring the data of a with a Cauchy filter whose FWHM is 240 μm results in an average pinwheel distance of 499.1 μm and 93 pinwheels. If the pattern in a is taken as the true in vivo orientation map, the pattern in b is that one that would be produced by imaging with the blur that we have estimated from our joint photon-scatter simulations and optics model. The pseudocolor map of orientation is provided below. (Scale bars, 1 mm.)

