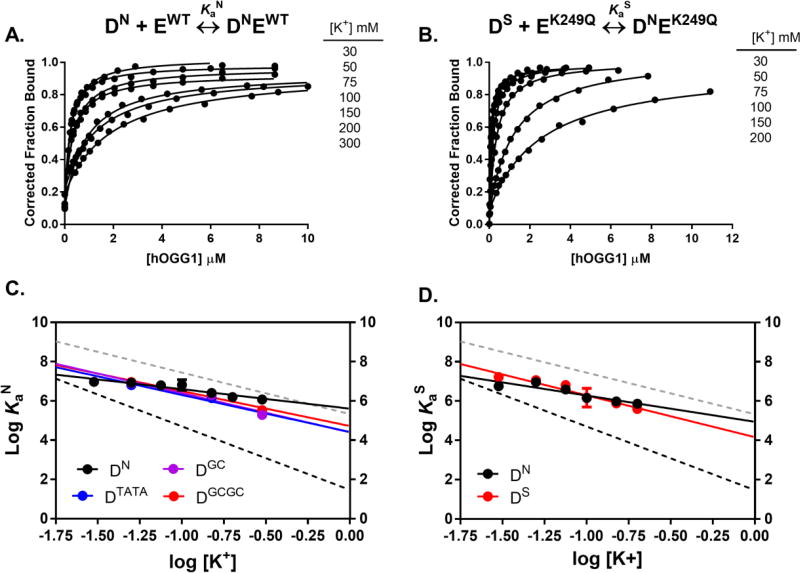
Figure 2.
Salt dependence of the non-specific and specific DNA binding affinity determined by fluorescence anisotropy measurements at 20°C. (A) Fraction bound of the non-specific DNA (DN = 25 nM) as a function of hOGG1 concentration at varying potassium ion concentrations (30 mM – 300 mM). Binding curves for the additional non-specific DNA oligos are provided in Figure S3. The salt concentrations listed match the relative positions of the corresponding data set. (B) Fraction bound of the specific DNA (DS = 10 nM) as a function of K249Q concentration at various potassium ion concentrations (30 mM – 200 mM). The salt concentrations listed match the relative positions of the corresponding data set. Data presented in both A and B are single trial measurements. The standard deviation in three replicate anisotropy intensity measurements was less than ±10% and that the Ka values and associated errors from independent measurements are reported in Tables 1 and 2. (C) Dependence of non-specific association constant (KaN) on the concentration of potassium acetate for WT hOGG1 binding to DN (black), DTATA (blue), DGC (purple), and DGCGC (red). Error bars are smaller than the size of the data markers. (D) Salt dependence of the non-specific (KaN) (black, left y-axis) and specific association constants (KaS) (red, right y-axis) for K249Q binding to DN and DS. Error bars are smaller than the size of the data markers. For comparison, black and grey dashed lines in C and D show the published salt dependences for non-specific and specific DNA binding by hUNG8.

