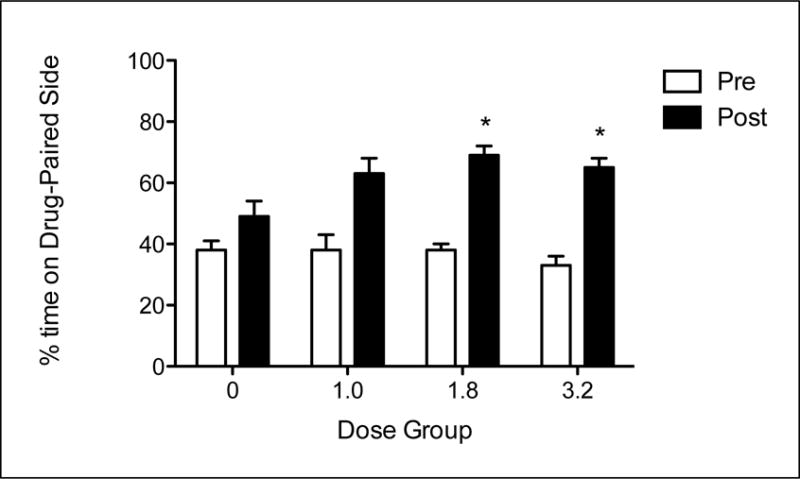
Figure 3.

Mean percent time spent on the nonpreferred side (± SEM) for all groups at Pre- and Post-test, collapsed across Sex. All groups (including vehicle) showed significant increase from Pre-test to Post-test. *Significant difference from Group 0.
