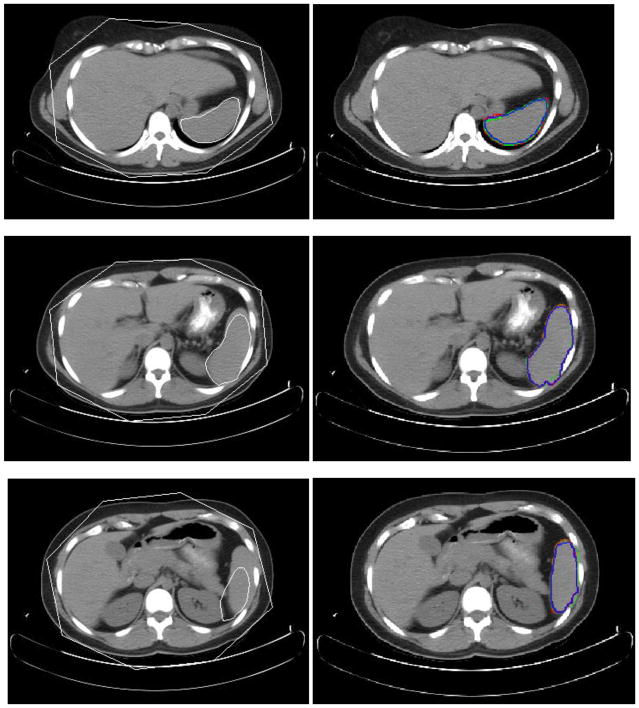
Fig. 11.
Experimental results for three slice levels of spleen segmentation. The left column is the MOAAM initialization result; the right is IGC-OAAM result in which red contour represents the reference image 1, green represents the reference image 2, and blue contour represents segmentation by the proposed method.

