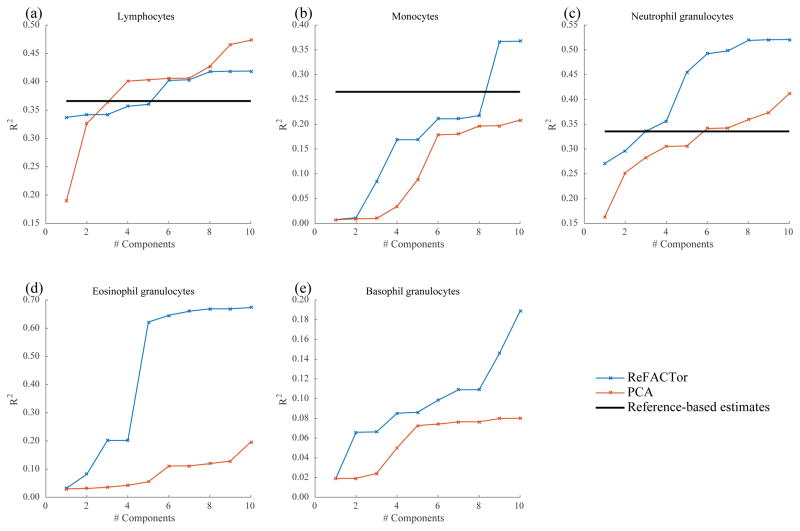
Figure 1.
The fraction of variance explained in each of the cell-types for which cell counts were available in the GALA II dataset (78 samples). The ReFACTor components are in blue, the PCs of standard PCA are in red, and the available estimates of the reference-based method are in black. (a) Correlation with lymphocytes cell count as a function of the number of components used in the linear predictor (squared linear correlation). (b) Correlation with monocytes cell count. (c) Correlation with neutrophil granulocytes cell count. (d) Correlation with eosinophil granulocytes cell count. (e) Correlation with basophil granulocytes cell count.

