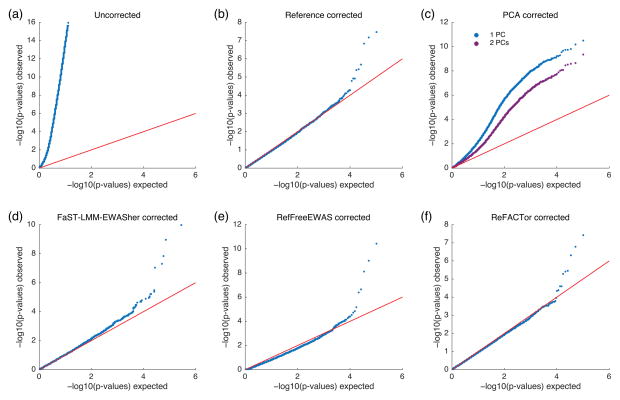
Figure 2.
Results of the RA methylation analysis, presented by quantile-quantile plots of the –log10 p-values for the association tests. Significant deviation from the red line indicates an inflation arising from a confounder in the data. (a) No correction. (b) Correction using the reference-based estimates of the cell-type proportions. (c) Correction using the first couple of PCs of a standard PCA. (d) Correction using RefFreeEWAS. (e) Correction using FaST-LMM-EWASher. (f) Correction using the first ReFACTor component.

