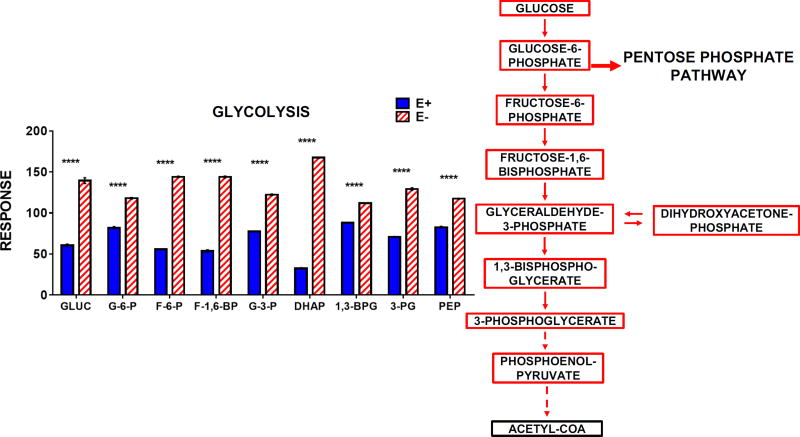
Figure 9.
E− larvae contain increased levels of glucose, glycolytic intermediates, and ketogenic amino acid when compared to E+ larvae. The outlined metabolic pathway diagram (left) shows the relationship of the metabolites shown in the bar chart. Solid lines indicate direct reactions and dashed lines denote several reaction steps between metabolites. Boxes shown in Red (increased in E− or Blue (increased in E+) represent metabolites that were higher in E− or E+ larvae, respectively. Black boxes indicate relative levels of a given metabolite are not shown in the figure. Data were analyzed as in Figure 7. Abbreviations: GLUC, glucose; G-6-P glucose-6-phosphate; F-6-P, fructose-6-phosphate; F-1,6-BP, fructose-1,6,-bisphosphate; G-3-P, glyceraldehyde-3-phosphate; DHAP, dihydroxyacetone phosphate; 1,3-BPG, 1,3-bisphosphoglycerate; 3-PG, 3-phosphoglycerate; PEP, phosphoenolpyruvate

