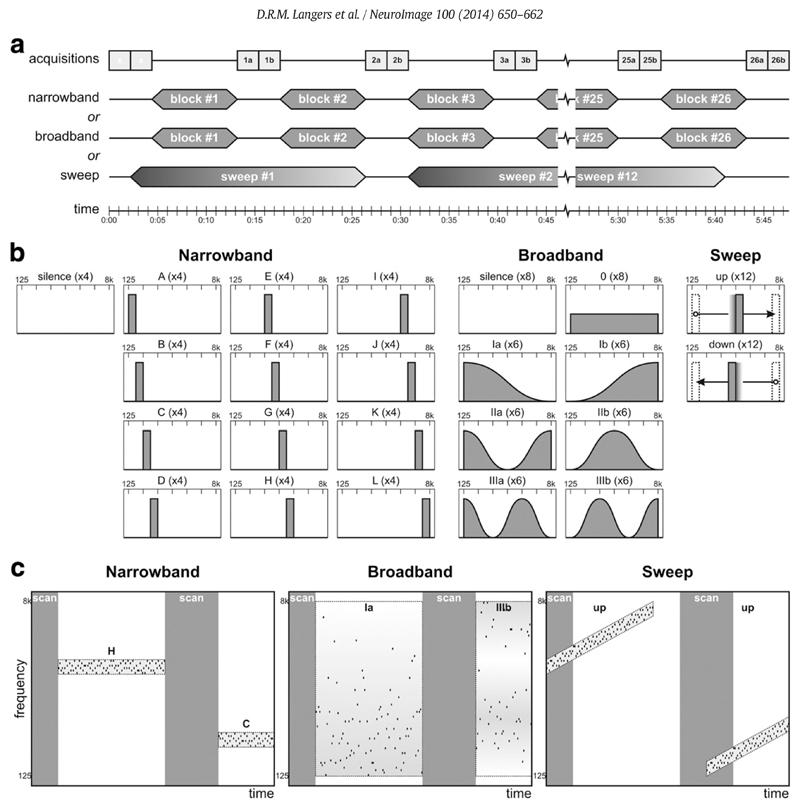
Fig. 1.
Experimental design. (a) The fMRI protocol consisted of 26 pairs of 2.2-s functional acquisitions separated by 8.8-s periods of scanner inactivity in each of the six runs per subject. In the narrowband and broadband runs, randomised stimuli were presented in blocks during the scan-to-scan intervals; in the sweep runs, 24.2-s upward or downward tone sweeps were repeated twelve times. (b) All stimuli consisted of sequences of jittered tones with frequencies between 125 Hz and 8 kHz presented at a rate of 10 Hz and loudness of 60 phon. For the narrowband sequences, twelve different stimulus conditions each comprised tones selected from a ½-octave frequency interval. For the broadband sequences, tones were selected from the entire 6-octave interval according to one of seven different probability distributions. For the sweep sequences, a ½-octave wide frequency window was swept up or down at a fixed rate on a logarithmic frequency scale. The narrowband and broadband runs additionally included silent baseline conditions; the sweep sequences were all separated by 4.4 s of silence. (c) Spectrotemporal illustration of a short excerpt of each of the stimulus protocols. Jittered sequences of pure tones (black dots) were presented, whilst scanning (grey bars) was performed in sparse fashion.

