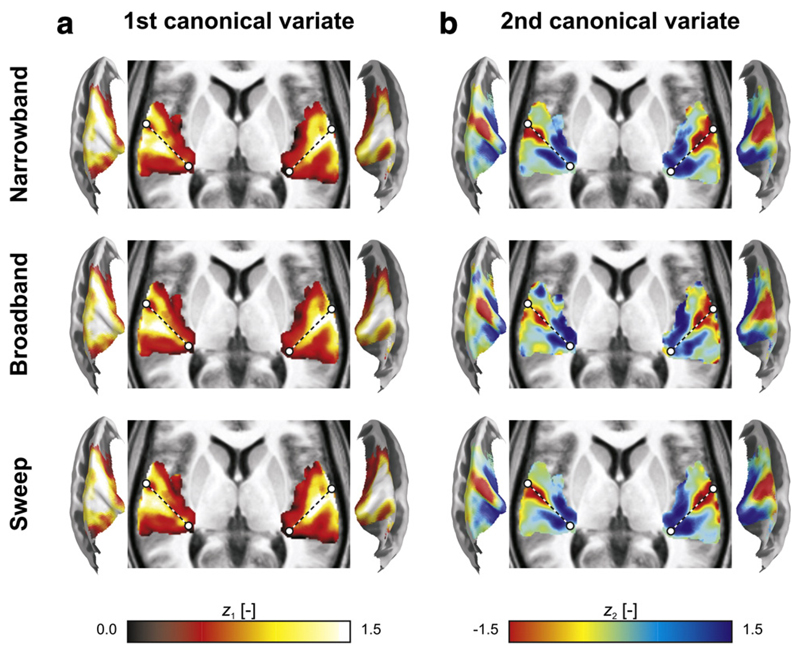
Fig. 7.
Volumetric projections across the z-direction (with dashed lines approximately outlining the axis of Heschl's gyrus) and semi-inflated cortical surface cross-sections display the maps zi,k of the first two canonical variates that were extracted from the narrowband, broadband, and sweep data simultaneously. (a) Activation maps, from the 1st canonical variate, and (b) tonotopic maps, from the 2nd canonical variate, were very similar to the principal component maps (see Fig. 4) except for scaling factors, and their interpretation was identical.

