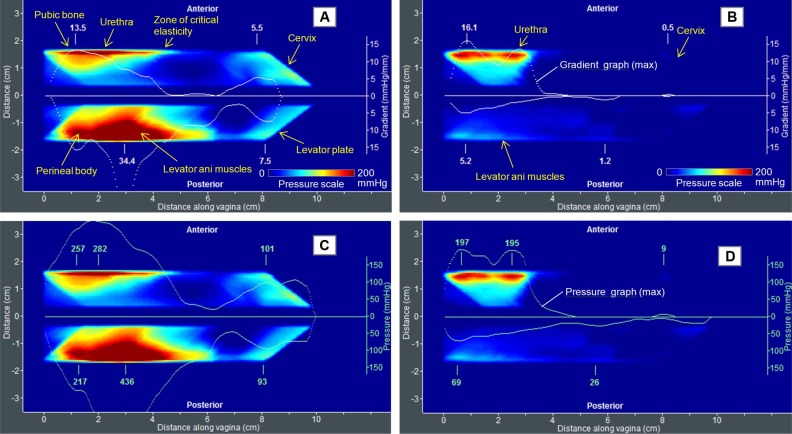
Figure 5.
Test 1 (VTI probe insertion) results for two patients with (A) stiff and (B) much softer vaginal tissue.
Notes: White lines show spatial pressure gradients for anterior and posterior compartments. Panels (C) and (D) are the same data as in panel (A) and (B), but with maximum pressure graphs (green lines) along the anterior and posterior compartments.
Abbreviation: VTI, vaginal tactile imaging.

