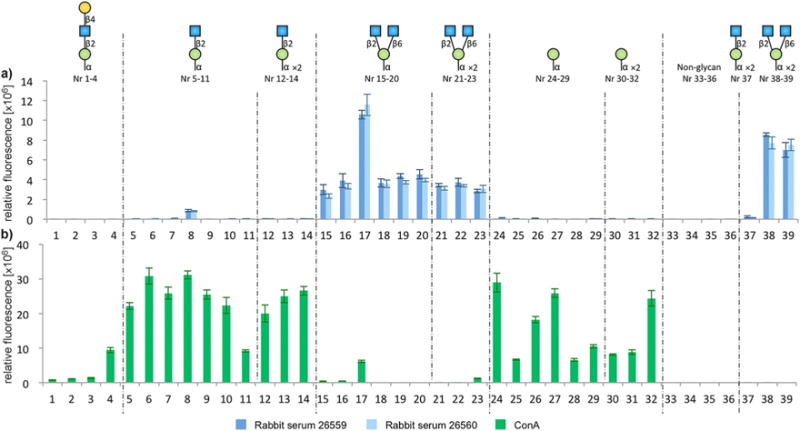
Figure 2.

Microarray analysis and evaluation of binding to spotted peptides 16–28 and 32–57 with a) the core m2 polyclonal rabbit sera 26559 and 26560 and b) Biotin–ConA. The x-axis shows the microarray peptide spotting ID numbers (details in Table 1) and y-axis shows the relative fluorescence, readout by a) a Cy5 secondary anti-rabbit antibody or b) Cy5-streptavidin.
