
Figure 2. (facing page). CD34+ Cell Enumeration and Assay of Hematopoietic Progenitors.
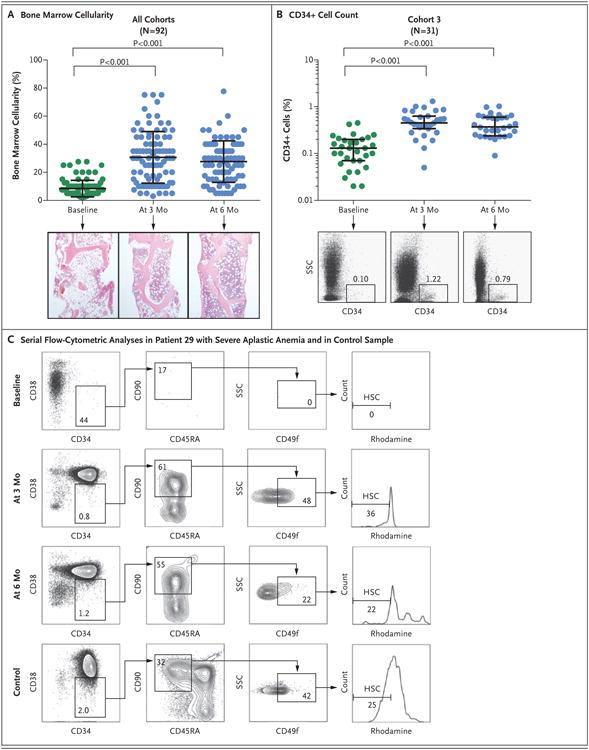
Panel A shows serial measurements of bone marrow cellularity in all 92 patients at baseline (green) and at 3 months and 6 months after the initiation of treatment (blue). Representative samples from bone marrow core biopsies (hematoxylin and eosin) obtained from Patient 7 at these three time points are shown. Each circle indicates one patient. The long horizontal bar indicates the mean, and the I bar the standard deviation. Panel B shows the serial quantification of CD34+ cells of the patients in cohort 3 at baseline (green) and at 3 months and 6 months after the initiation of treatment (blue). The long horizontal bar indicates the median, and the I bar the interquartile range. Representative flow-cytometric analyses at these three time points are shown for Patient 67; the numbers in the boxes represent the percentages of cells within the indicated fraction. SSC denotes side scatter. At 3 months, the median fraction of CD34+ cells in this cohort had increased from the baseline value by a factor of 3 (baseline value, 0.13%; value at 3 months, 0.45%; and value at 6 months, 0.37%). Similarly, the numbers of CD34+ cells in bone marrow increased during treatment in cohorts 1 and 2 (Fig. S5 in the Supplementary Appendix). Panel C shows representative serial flow-cytometric analyses of phenotypically defined hematopoietic stem cells (HSCs; CD34+CD38–CD45RA–CD90+CD49f+ phenotype with low rhodamine uptake) in the bone marrow of Patient 29 and in a sample obtained from a healthy person (control).21 Nucleated bone marrow cells were initially enriched for CD34+ cells by Magnetic Automated Cell Separation (MACS) and analyzed by means of flow cytometry for markers expressed on HSCs. Owing to the paucity of CD34+ cells at baseline, most of the cells that were measured had a CD34– phenotype. Representative flow-cytometric analyses of multipotent progenitors are shown in Figure S5 in the Supplementary Appendix. The P values were calculated by one-way analysis of variance.