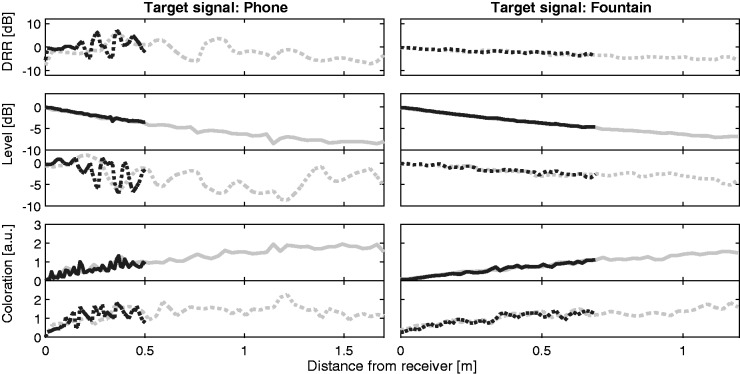
Figure 6.
Left: changes in DRR (top), overall level (middle), and spectral coloration (bottom) for the phone signal moving either 0.5 m (black) or 1.7 m (gray) away from the listener over 2.3 s. Changes in overall level and spectral coloration are shown for both anechoic (solid lines) and reverberant (dashed lines) conditions. Right: corresponding plots for the fountain signal moving either 0.7 m (black) or 1.3 m (gray) away from the listener.
DRR = direct-to-reverberant sound ratio.

