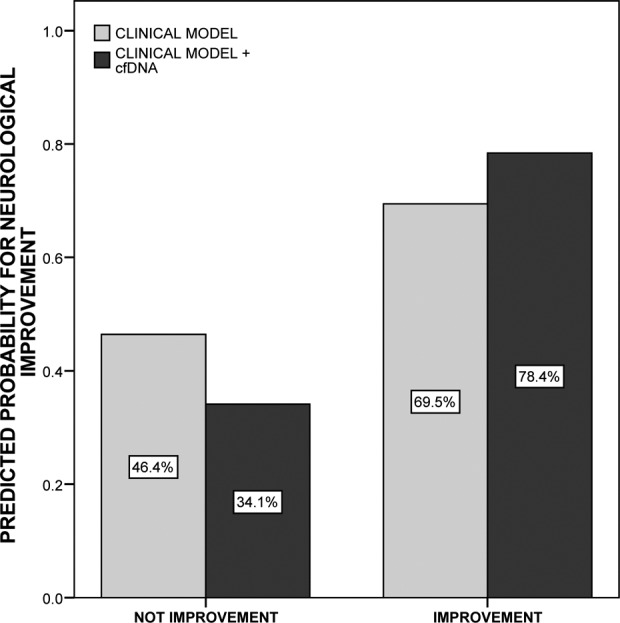
Figure 2.

Comparison between predictive models for 48 h neurological improvement. Light bars represent the predictive ability of the clinical model, composed by 1-h recanalization adjusted by age, gender and baseline National Institutes of Health Stroke Scale score. Dark bars represent the predictive ability of the second model, constructed by adding cfDNA levels <302.75 kilogenome-equivalents/L over the only clinical model. The integrated discrimination improvement index was 21.2% (9.2–33.3%), p = 0.0005. cfDNA: circulating cell-free DNA.
