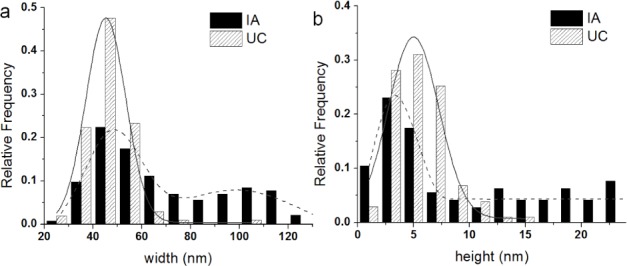
Figure 6.

The size distributions of exosomes depending on isolation methods. The width distributions (a) and the height distributions (b) are shown with Gaussian fits. The width distribution of exosomes isolated by IA show a bimodal population, with the first peak at 23.9 ± 3.2 nm and the second peak at 54 ± 18 nm. The width distribution of exosomes isolated by UC show a single Gaussian population with the peak at 45.2 ± 0.1 nm. The height distribution of exosomes show a single Gaussian population for both methods, with the peak at 3.2 ± 0.5 nm for IA and 5.0 ± 0.3 nm for UC. The width and the height of exosomes from IA and UC were significantly different at p<0.05.
