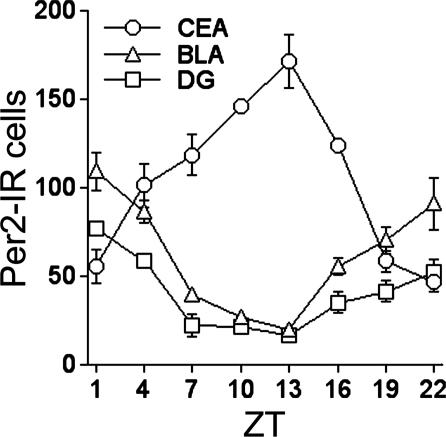
Fig. 2.
Mean (± SEM) number of PER2-immunoreactive nuclei in the CEA, BLA, and CA3 regions of the DG of rats killed at different ZTs (n = 4 per time point). Cells immunopositive for PER2 were counted manually by using a 400 × 400-μm template for the CEA and BLA and a 200 × 400-μm template for the DG. The number of PER2 immunoreactive cells per region was calculated for each animal from the counts of 10 images showing the highest number of labeled nuclei.

