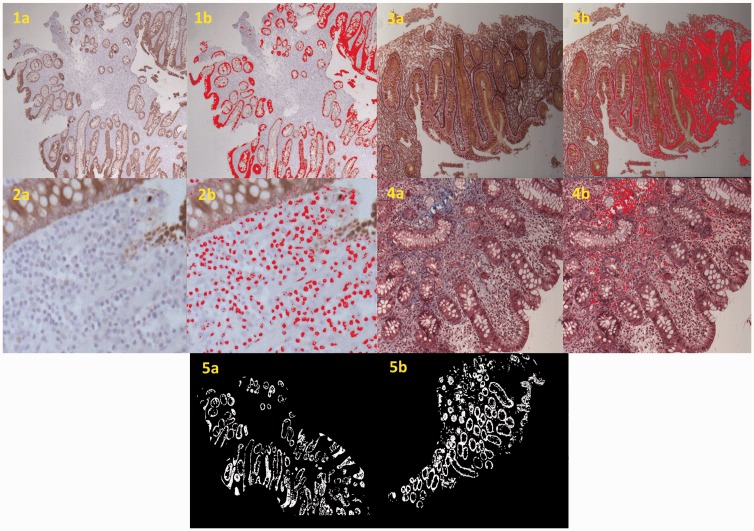
Figure 1.
Examples of morphometric measurements. The left image in each pair represents the clean stained histological specimen whereas the right image displays the quantified variable during image analysis (1a + 1b: CK stain highlighting the crypts; 2a + 2b: CK stain negative highlights the inflammatory cells; 3a + 3b: reticulin stain highlighting young collagen; 4a + 4b: Mason TC stain highlighting mature collagen; 5a + 5b: image masking highlights the mucosal architecture). CK: pancytokeratin; TC: Tri-chrome.

