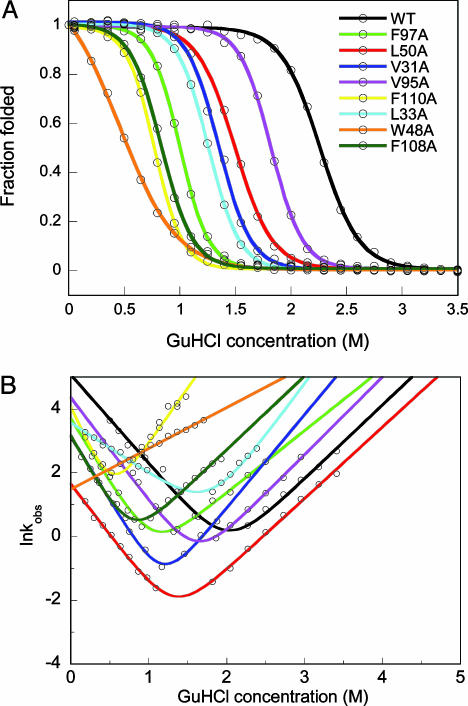
Fig. 1.
Equilibrium and kinetic folding data. (A) GuHCl-induced equilibrium unfolding of WT and apo-azurin variants. For each protein, far-UV CD- and fluorescence-detected transitions overlap (fluorescence data shown). Solid curves are two-state fits to each set of data (see Table 1). (B) Semilogarithmic graph of lnkobs versus GuHCl for WT and point-mutated apo-azurins. For each protein at each solvent condition, kinetic folding/unfolding traces monitored by far-UV CD and fluorescence are identical (fluorescence data shown). Solid lines are fits to two-state kinetic equations. Because of low stability of Trp-48–Ala apo-azurin, only kU values were measured (these data are fitted to a line, the unfolding arm). Folding rate constants are reported in Table 1.

