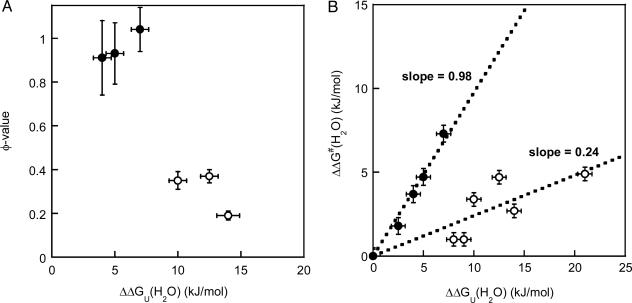
Fig. 2.
Residue-specific transition-state analysis. (A) φ values as a function of protein stability effect [ΔΔGU(H2O); with respect to WT apo-azurin] for six apo-azurin variants (data taken from Table 1). The two classes of variants, as discussed in the text, are shown by open (low φ) and filled (high φ) circles. Standard deviations are shown in both dimensions. (B) Brønsted analysis of azurin mutations. Plot shows ΔΔG‡(H2O) versus ΔΔGU(H2O) (see Table 1 for definitions), with standard deviations in both dimensions, for the eight positions studied here and His-117–Gly and His-46–Gly apo-azurin variants (6). The separation of the data points into two discrete sets illustrates that the folding nucleus is not uniform but divided into (at least) two regions. The two groups are represented by filled (slope = 0.98, R = 0.99) and open circles (slope = 0.24, R = 0.84).

