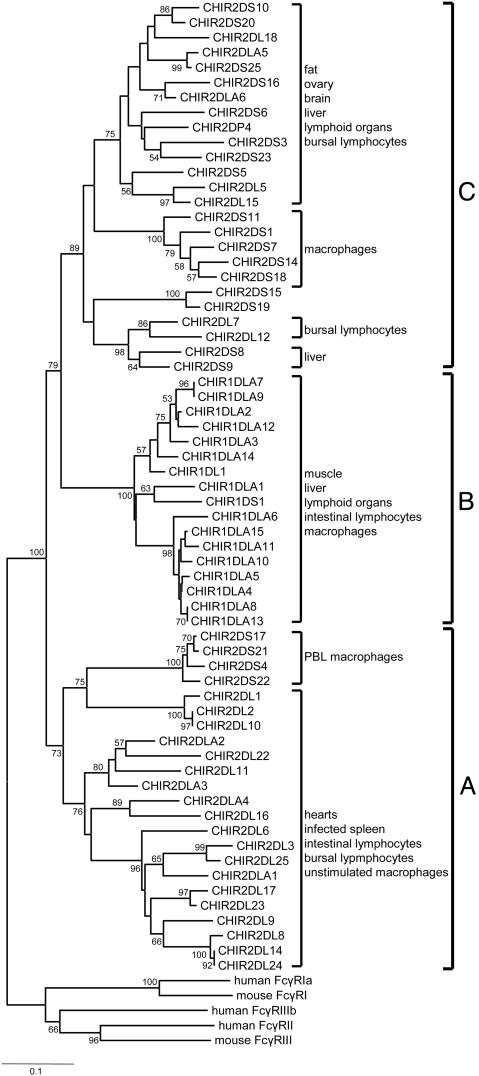
Fig. 2.
Neighbor-joining tree of the D1 Ig-like domain of the CHIR sequences. The tree was constructed with p distances for 90-aa sites after elimination of alignment gaps. The numbers on the interior branches represent bootstrap values (only values >50 are shown). The sequences of the mammalian Fc receptors were used as outgroups (see also figure 1 of ref. 7). The expression patterns (tissue or cell) of the different CHIRs according to the EST analysis are also shown. The cutoff values for assigning an EST sequence to a particular group of CHIR genes were >90% identity and >90% coverage of the EST sequence. The EST accession numbers are available from M.N. upon request.

