
Figure 1.
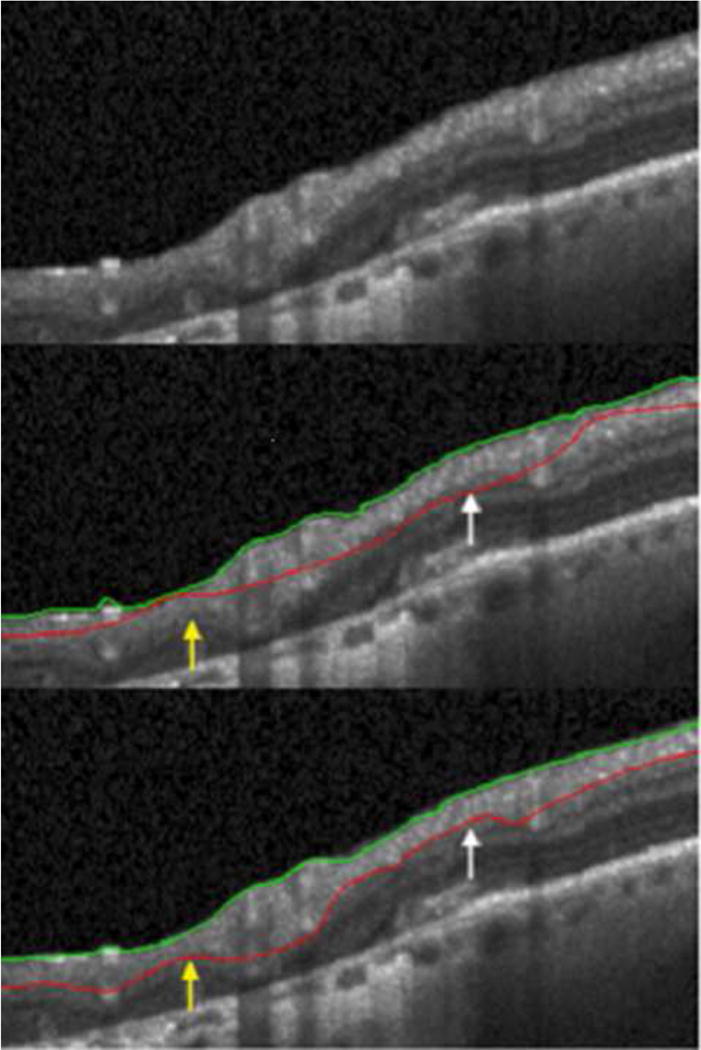
Top panel is a section of raw images from the optical coherence tomographic circle scan. Middle panel shows machine delineation of the retina layers that overestimates (white arrow) and underestimates (yellow arrow) the retinal nerve fiber layer (RNFL) thickness. Bottom panel shows the RNFL thickness after manual refinement of the automated segmentation. Green line: Inner Limiting Membrane. Red line: Posterior RNFL boundary.