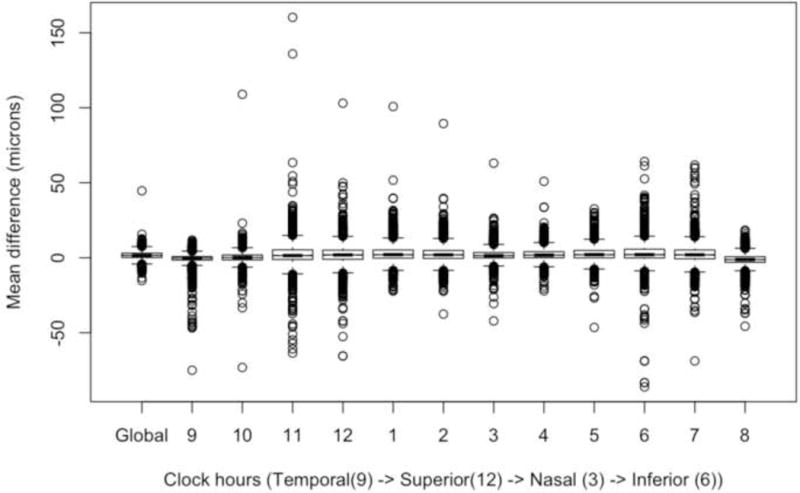
Figure 4.

This is a notched box plot with global difference (manual refinement minus automated segmentation) and twelve 30-degree sectors (clock hours) in a right eye configuration, oriented by TSNIT (temporal to superior to nasal to inferior to temporal) location. It is similar to Figure 3 but displays outliers to demonstrate the magnitude of errors within sectors.
