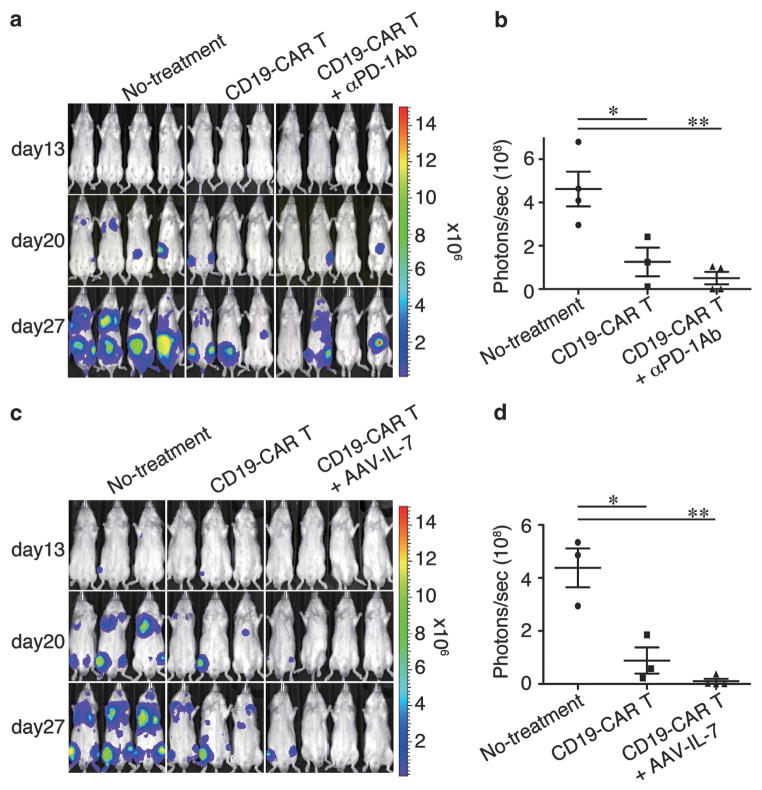
Figure 4.
(a) Bioluminescent imaging of systemic Raji tumor progression in Rag2−/−γc−/− mice following T-cell infusion. Mice inoculated intravenously with Raji/Luc cells on day 0 were infused with CD19-CAR T-cells alone on day 3 (T-cell treatment group, n =3) or in combination with three intraperitoneal injections of an anti-PD-1 antibody (n =4), whereas mice in the control group did not receive T-cells (n =4). (b) Quantitative bioluminescence imaging on day 27 as shown in panel (a). (c) Raji tumor-bearing mice were infused with CD19-CAR T-cells alone (n =3) on day 3 or in combination with a single intramuscular injection of AAV-IL-7 (n =4). (d) Quantitative bioluminescence image on day 27 as shown in panel (c). Bioluminescent imaging was performed on days 13, 20 and 27. *P<0.05, **P<0.01.

