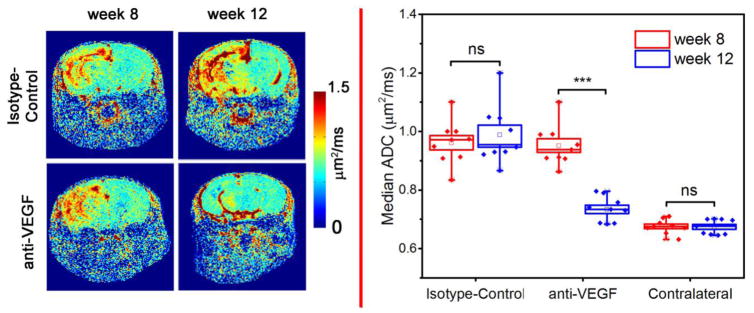
Fig. 2.
Anti-VEGF treatment response, detected by diffusion-weighted MRI. The left panels display representative ADC maps. Boxplots (n = 9), on the right, show median ADCs across the lesions. The contralateral group represents normal brain ADCs. “***” and “ns” indicate P<0.001 and no significance, respectively

