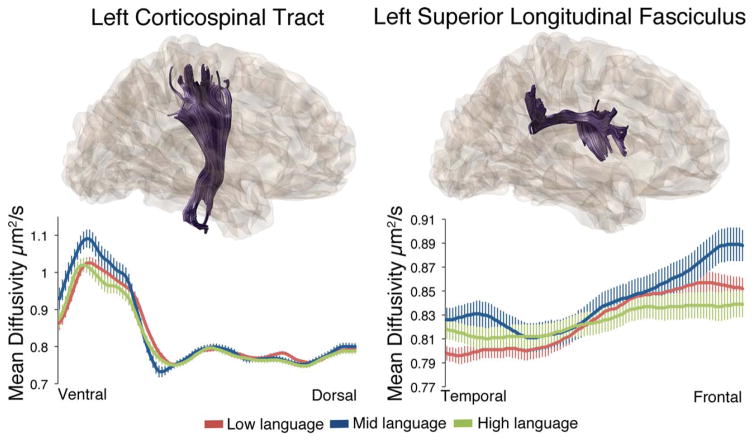
Figure 5.
Mean diffusivity values differ along the length of the left corticospinal and left superior longitudinal fasciculus across the three language groups. Tractography reconstructions for each tract are depicted on top, and MD values along the length of each tract are depicted in the line graphs on the bottom. Values are group means ± SEM.

