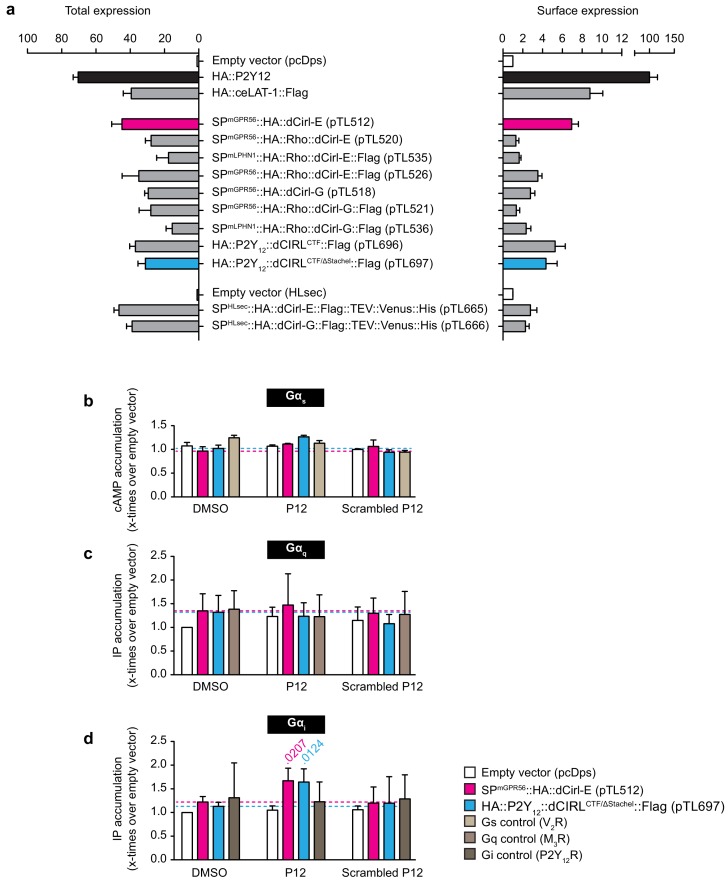
(a) Total and cell surface expression of various dCirl constructs. COS-7 cells were transfected with 1 µg (total expression)/0.5 µg (cell surface expression) of empty vector (pcDps or pHLSec) or plasmid encoding either dCirl constructs, the C. elegans Latrophilin homolog lat-1 or the human ADP receptor P2Y12 which served as controls. Expression levels were measured 48 hr post transfection using ELISA on lysed cells (total expression) or intact cells (cell surface expression). Data are displayed as x-fold of empty vector and displayed as mean ± SEM of at least three independent experiments, each performed in triplicate. (b) Peptide-stimulated cAMP response of dCIRL. COS-7 cells transfected with 0.2 µg empty control vector (pcDps) or plasmid encoding dCirl were stimulated with 1 mM putative Stachel sequence-derived peptide of 12 aa length and cAMP levels were measured by cAMP accumulation assay. A scrambled peptide of the same length and amino acid composition (scrambled P12) served as negative control. To control for peptide specificity, the human vasopressin type 2 receptor (V2R) was used, which does not respond to the peptides tested. Basal cAMP levels (empty vector, no peptide) are 3.2 ± 0.7 nM. Data are normalized to respective non-stimulated controls and are given as mean ± SEM. (c) dCIRL does not signal via a Gq protein signaling cascade upon treatment with Stachel sequence-derived peptides. COS-7 cells transfected with 0.2 µg empty control vector (pcDps) or plasmid encoding dCirl were stimulated with 1 mM peptide and IP accumulation assays were performed. Neither the potentially activating peptide nor the scrambled peptide show any effect on dCIRL. The rat muscarinic M3 acetylcholine receptor M3R was used as a control for peptide specificity. Basal IP levels (empty vector, no peptide) are 434 ± 52 nM. Data normalized to respective non-stimulated controls are given as mean ± SEM of four independent experiments, each performed in triplicate. (d) dCIRL is activated by P12 to mediate a Gi protein signal. To measure functional coupling of dCIRL to Gαi upon stimulation with P12, a chimeric Gαqi4 protein was applied to reroute a Gi-mediated signal to a Gαq protein cascade. 0.2 µg of plasmid containing pcDps or dCirl were co-transfected with 0.02 µg plasmid with the chimeric protein DNA into COS-7 cells. IP accumulation assays were performed detecting Gαq-mediated increase in IP levels upon treatment with 1 mM peptide P12 or scrambled P12. A significant increase in IP was detected upon P12 challenge. The human P2Y12 receptor served as a control for peptide specificity. Basal IP levels (empty vector, no peptide): 385 ± 32 nM. Data normalized to respective non-stimulated controls are given as mean ± SEM of four independent experiments, each performed in triplicate. p values < 0.05 are indicated above the respective columns, all others were > 0.05.


