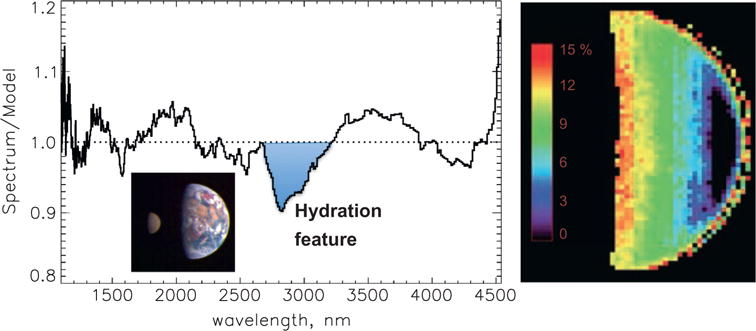
Fig. 1.

Spectroscopic detection of lunar mineral hydration. (Left) 2.8 μm feature in disc-integrated 1–5 μm spectrum divided by a model for reflectance plus thermal emission, from the pictured observation in a May 2008 transit of Earth by the Moon (Livengood et al., 2011). (Right) Map of lunar hydration feature band depth in June 2009, looking down on the north pole, showing strongest hydration at terminator; reprinted from Sunshine et al. (2009).
