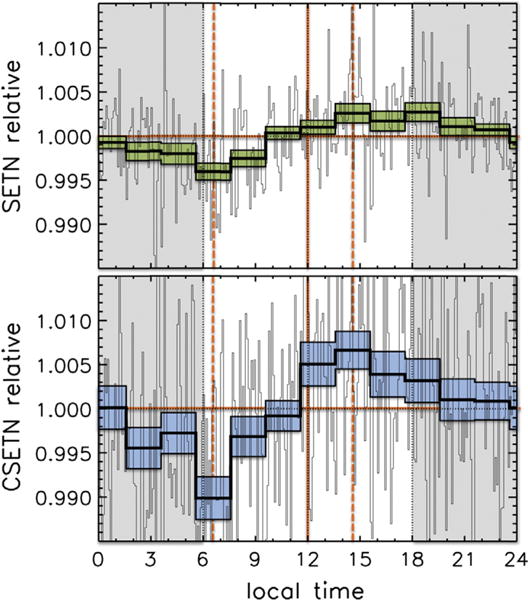
Fig. 3.

Equatorial neutron detection rate varies as a function of local time for SETN (upper) and CSETN (lower) epithermal neutron detectors, relative to the median. Gray regions at left and right indicate measurements during lunar night. The light-toned rapidly-varying histogram shows flux measured in intervals of 5 min of lunar local time. The bold histogram and shaded envelope show mean and standard error of the mean in two-hour intervals of lunar local time. Greatest flux suppression is near the dawn terminator, slightly biased toward the day side.
