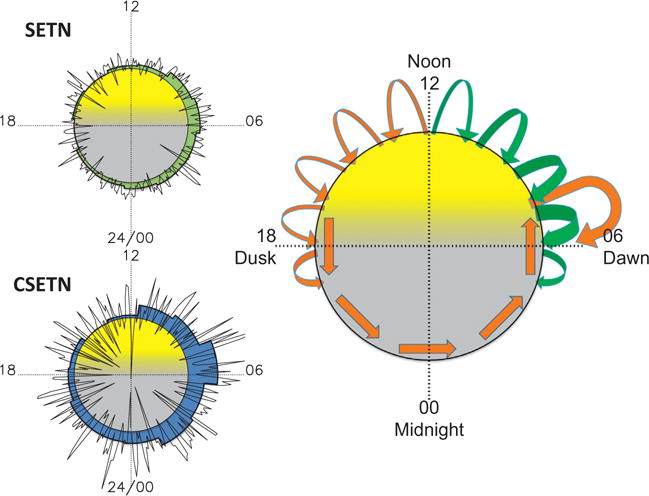
Fig. 4.

Hydrogen distribution with local time, and sketch of lateral transport processes; see tables for quantitative values. (Upper left) 5-min sampled hydrogen concentration as a function of local time, determined from SETN detector, two-hour binned estimates shown by green-shaded region. (Lower left) Similar display for CSETN detector, same scale, two-hour binned concentration shown by blue-shaded region, with distinct maximum in post-dawn bin. (Right) Schematic of volatile migration at equator by ballistic hopping (curved arrows) and transport in regolith by the Moon’s rotation (tangential arrows); source of volatiles is unspecified. Volatiles that initially migrate east (orange) condense or adsorb onto regolith overnight, then remobilize after dawn and migrate back to cold terminator (curved orange arrow). Volatiles that initially migrate west (green) are reinforced by previously-trapped volatiles that thermally desorb from the surface in the morning sector.
