
Figure 3. PHD proteins regulate reciprocal iTreg and Th1 differentiation programs.
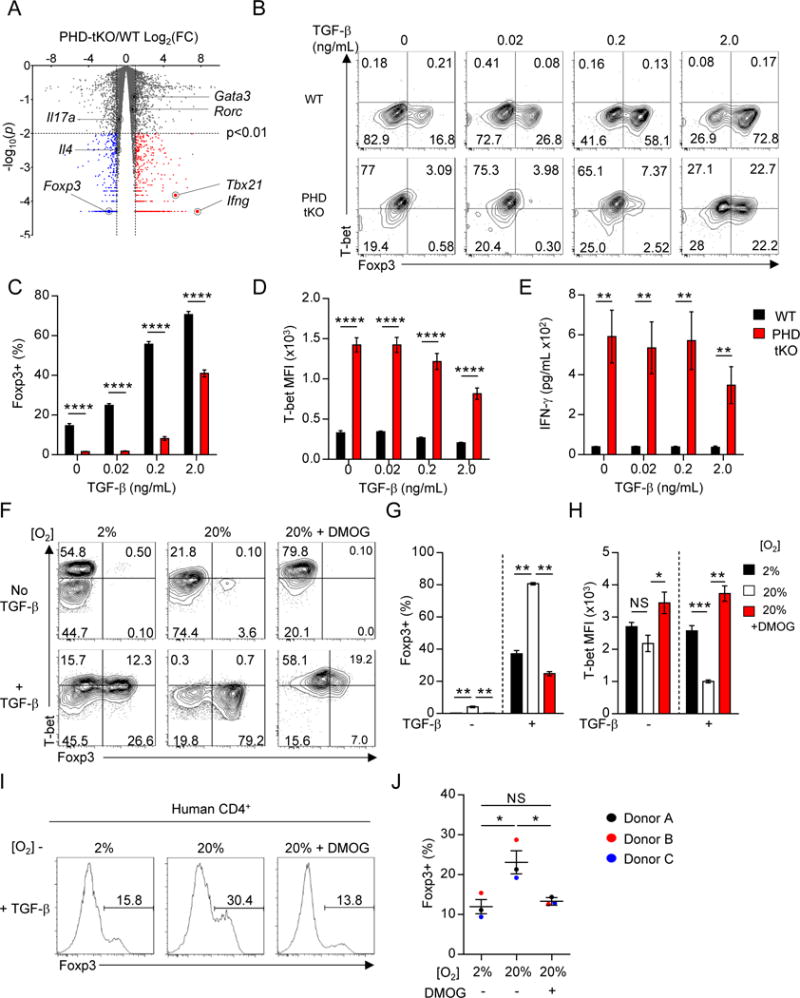
(A) Volcano plot of expressed transcripts (RPKM≥1) in PHD-tKO compared with WT CD4+ T cells stimulated in vitro. Transcripts significantly (p<0.01) over-expressed (FC≥2, red) and under-expressed (FC≤0.5, blue) in PHD-tKO cells are indicated.
(B–D) Foxp3 and T-bet expression in WT and PHD-tKO CD4+ T cells stimulated in vitro in the presence of indicated amounts of TGF-β. Representative flow cytometry (B) and replicate values for Foxp3 (C) and T-bet (D) are shown.
(E) ELISA quantification of IFN-γ in culture supernatants from WT and PHD-tKO CD4+ T cells stimulated as described in (B).
(F–H) Foxp3 and T-bet expression in WT CD4+ T cells stimulated in vitro under the indicated environmental oxygen concentrations ± DMOG. Representative flow cytometry (F) and replicate values (G–H) shown.
(I–J) Foxp3+ iTreg fate specification of human CD4+ T cells stimulated in vitro under the indicated environmental oxygen concentrations ± DMOG. Representative flow cytometry histograms (I) and replicate values are shown (J).
Data are representative of ≥ 2 independent experiments. Bars and error represent mean ±SEM of replicate measurements. *P<0.05, **P<0.01, ***P<0.001, ****P<0.0001 (Student’s t-test).
See also Figure S3.